
The Truth Behind the 2026 Toronto and Vancouver Housing Price Declines: Why Improved Affordability Still Fails to Activate Buyers?
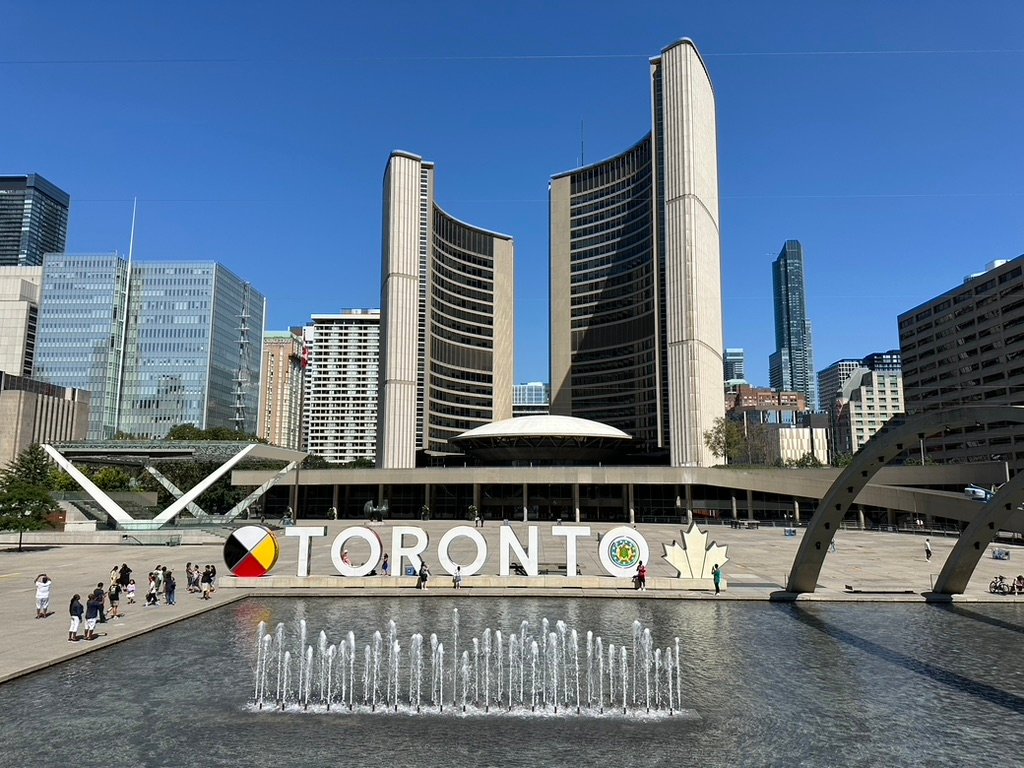
The national RBC Housing Affordability Measure fell to 52.4% in Q4 2025, marking the eighth consecutive quarter of improvement — a 10.6 percentage point drop from the historical peak at the end of 2023. However, RBC’s latest report明确指出 that the improvement momentum is becoming “sluggish and sparse,” with the average improvement over the past two quarters仅为 -0.4 percentage points, far below the -1.6 percentage point average of the previous year and a half.Vancouver (improved 7.2 percentage points year-over-year) and Toronto (improved 6.9 percentage points) contributed the vast majority of the national measure’s decline. Excluding these two cities, the national improvement would narrow significantly.
The Core Truth: National data masks the harsh reality of regional divergence — Toronto and Vancouver’s price declines are driven by high inventory, while other markets (such as Montreal and Quebec City) face tight supply and rising prices. RBC explicitly states: “Vancouver and Toronto — where prices have been falling this past year — account for most of the national measure’s decline.”Buyer’s market characteristics (Sales-to-New Listings Ratio remaining persistently low) are evident in both cities, yet actual demand remains unactivated. RBC concludes that the recovery phase is nearing its end, and further improvement will require more substantial price adjustments.
相关视频解读
视频来源:北美在线(YouTube @139)
🍁 Toronto Region
Toronto’s RBC measure has fallen to 62.9%, reversing 80% of the affordability deterioration accumulated during the pandemic (compared to a national average of 52%), making it Canada’s fastest-recovering market. Yet, Toronto housing price trends remain weak: ample inventory (particularly in the condominium segment), sluggish sales, and a strong wait-and-see sentiment among buyers.
RBC emphasizes: “Nevertheless, buyers in Toronto still face significant hurdles — owning a home at current average prices would consume 62.9% of a typical household’s pre-tax income.” The psychological gap remains immense — “prices have dropped, but the average person still cannot afford it.”
📊 Notable Buyer’s Market Characteristics: The Sales-to-New Listings Ratio remains at low levels, with intense seller competition and continued downward pressure on prices. RBC notes: “We think this pressure will keep buyers on the sidelines and motivated to press sellers for further price concessions.”
🏢 Condos vs. Single-Family Homes: RBC historical data shows that single-family homes are significantly less affordable than condos, making condos the only entry point for first-time buyers. This “two-tiered market” structure explains why transaction volumes struggle to recover — high-income households dominate the single-family segment, while middle- and low-income buyers are left with only oversupplied condos as their ticket in.
🏔️ Vancouver Region
Vancouver’s RBC measure remains at a staggering 88.2%, solidifying its position as Canada’s most unaffordable market. Despite leading the nation in year-over-year improvement, it has only reversed half of the cost surge experienced during the pandemic. RBC states bluntly: “Vancouver remains the most burdened market in the country.”
This level of improvement is virtually meaningless for typical households: a typical family would need to spend well over 100% of pre-tax income to afford a single-family home.Vancouver housing affordability has entered an extreme range — even condos, while relatively more affordable, remain well above their long-term historical averages.
📉 “A Full-Blown Downturn”: RBC uses this phrase to describe Vancouver’s current state. Months of inventory exceeding 3.5 months, coupled with a depressed SNLR, create a psychological expectation loop where price declines improve the affordability measure while simultaneously reinforcing buyer expectations that “prices will fall further.”
🏠 Buyer Psychology: “It’s no wonder many potential buyers are waiting for additional price declines before jumping in. We think continued ample supply will keep values under downward pressure.”
| Metric Dimension | Toronto | Vancouver |
|---|---|---|
| RBC Aggregate Measure (2025 Q4) | 62.9% | 88.2% |
| Year-over-Year Change | -6.9pp | -7.2pp (Largest Nationwide) |
| Q4 Single-Quarter Change | -1.8pp | -0.7pp |
| Pandemic Gains Reversed | ~80% (Leading Recovery) | ~50% (Halfway There) |
| Market Status (RBC Qualitative) | Buyer’s Market, Highly Cautious Buyers | Full-Blown Market Downturn |
| Inventory Status | Ample (MOI > 3.5) | Ample (MOI > 3.5) |
| SNLR Positioning | Low (Buyer’s Market) | Low (Buyer’s Market) |
| RBC Price Outlook | Buyers will continue seeking concessions | High inventory will continue suppressing prices |
The Twin Cities’ Predicament: The commonality between these two markets is that absolute prices remain far beyond the affordability limits of typical households. With RBC measures fluctuating between 60% and 90%, even continued price declines would still leave homeownership costs consuming a prohibitive share of household income. This is the root cause of why a buyer’s market fails to activate transactions.
💡 Strategic Recommendations for H2 2026
🏠 Buyer Recommendations
- Monitor SNLR recovery above 0.4 as a signal of price stabilization
- The condo market remains the only pressure relief valve — look for opportunistic purchases
- Conduct rigorous interest rate stress testing to avoid cash flow constraints
📈 Seller Recommendations
- Acknowledge the buyer’s market reality — pricing must be aggressive
- Don’t wait for favorable signals; expedite transactions rather than hold long-term
One Sentence Summary: The truth behind Toronto and Vancouver price declines is a high-inventory-driven structural adjustment, not a national recovery signal. Throughout 2026, buyer’s market conditions will persist for an extended period.
📚 Data Sources & Notes
Core Source: RBC Economics, “Canada’s Housing Affordability Improvement Slows,” released March 31, 2026.
Measure Definition: The RBC measure represents the share of pre-tax household income required to cover homeownership costs (mortgage principal and interest, property taxes, utilities), based on a 20% down payment and a 5-year fixed-rate mortgage.
HousingAI · Data-Driven Real Estate Insights · Counter-Narrative Stance
This analysis is based on RBC official data. Does not constitute investment advice.